« Rear brakes | Main | I should've used 3rd gear... »
November 3, 2006
Analyzing the Data from Lime Rock Park
I've had this Race Technologies DL90 for about 3 years now, and finally got to use it for all my sessions last week. The Camaro is about 3700 lbs, 500 rwhp, and has old, hard, Kumho Victoracers right now. It was oversteering heavily with the 900F 175R and stock PHB height. Brakes are the marginal stock 10.4" rotors with single piston metric 154 calipers on old fluid and race pads. The driving conditions were pavement temps of about 60 in the sun, and about 20 cars in my run group on a 1.53 mile long track (crowded), with passing only allowed on the front and back straights.
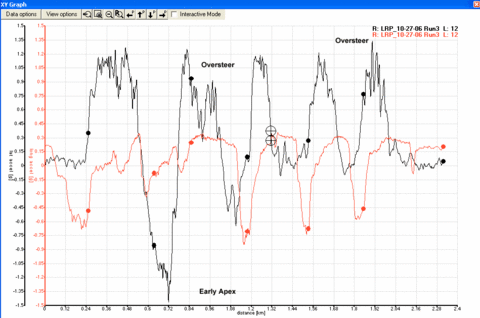
The lateral G graphs have left turns pointing down (the graph shows which way the g's are pulling) and rights pointing up. The solid dots are sectors markers from the track map.
A telltale sign of an oversteering car is wild swings in the lateral G graph. If you have a steering angle sensor, it would also show corrections, and lower steering angle than on a non-oversteering corner. Understeer would show up as a plateau after the peak, with steering angle decreasing and G's staying steady. The other sign noticeable is the early apex signature on the only real left hand corner. This is a throwaway corner, since it leads to the right hander before the back (noname) straight, and I stayed to the inside, to set up for the next corner, rather than tracking out. The classic sign is an late peak in the lateral G trace. A late apex will show up as peak early on, since that is the tightest part of the corner. The third right (upwards peak) is the uphill corner, and shows a late apex trace.
Posted by Z28tt at November 3, 2006 9:06 AM
